बजारको चाल र टेक्निकल एनालिसिस: लगानीकर्ताले बुझ्नुपर्ने कुरा
Author
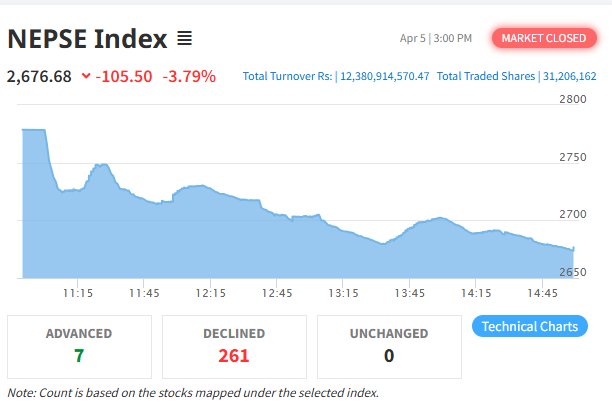
NEPSE trading

शेयर बजारको चलखेललाई सही ढंगले बुझ्नको लागि लगानीकर्ताले विभिन्न दृष्टिकोणहरूबाट विश्लेषण गर्नुपर्छ। यसका लागि टेक्निकल एनालिसिस प्रमुख उपकरण हो जसले बजारको विगतका तथ्यांकहरू र भविष्यको सम्भावित चालबारे पूर्वानुमान गर्न सघाउँछ। विशेष गरी नेपालजस्ता विकासशील बजारहरूमा, जहाँ बजारका उतार-चढाव स्थिर छैनन्, लगानीकर्ताहरूले सही समयमा निर्णय लिन र जोखिमलाई नियन्त्रण गर्न यस प्रविधिलाई प्रयोग गर्छन्। यस ब्लगमा, हामी टेक्निकल एनालिसिस के हो, यसको प्रमुख तत्वहरू, कसरी काम गर्छ, र कसरी यो लगानीकर्ताका लागि उपयोगी हुन सक्छ भन्ने विषयमा चर्चा गर्नेछौं।
टेक्निकल एनालिसिस भनेको के हो?
टेक्निकल एनालिसिस भनेको विगतका मूल्यका चलखेल (price movements), ट्रेडिङको मात्रा (trading volume), र अन्य प्राविधिक सूचकांकहरूको आधारमा भविष्यमा बजारको चाल कस्तो हुन सक्छ भन्ने अनुमान गर्ने विधि हो। यसले बजारमा भएका क्रय र विक्रयका क्रममा देखिएका पहिचानयोग्य ढाँचाहरू (patterns) लाई विश्लेषण गरेर निर्णयमा सहयोग गर्छ। यसको मुख्य मान्यता यो हो कि कुनै पनि परिसम्पत्तिको मूल्यमा भएको परिवर्तन विगतका चलखेलहरूमा आधारित छ र विगतका तथ्यांकहरू नै भविष्यको सम्भावनाहरू दर्शाउँछन्।
बजारको चाल बुझ्नका लागि प्रमुख तत्वहरू
१. मूल्यको चलखेल (Price Movement)
कुनै पनि परिसम्पत्तिको मूल्य घटबढ नै बजारको प्राथमिक संकेत हो। टेक्निकल एनालिसिसमा प्रायः चार्टहरूको प्रयोग गरेर विगतका मूल्य परिवर्तनलाई ट्र्याक गरिन्छ। यो मूल्य परिवर्तन विभिन्न अवधिमा भएको आधारमा देख्न सकिन्छ, जस्तै दैनिक, साप्ताहिक, वा मासिक रूपमा। मूल्यको चलखेल अध्ययन गर्दा तीन प्रकारका बजार अवस्थाहरू हुन्छन्:
उदयीमान (Bullish) बजार: बजारमा लगानीकर्ताहरू क्रयका लागि इच्छुक छन्, जसका कारण परिसम्पत्तिको मूल्य निरन्तर वृद्धि हुँदै जान्छ।
अधोगामी (Bearish) बजार: विक्रेताहरू हावी हुन्छन् र परिसम्पत्तिको मूल्य घट्दै जान्छ।
तटस्थ (Sideways) बजार: बजारमा न त वृद्धि न त गिरावट देखिन्छ, मूल्य एक सीमित दायराभित्र झुलिरहेको हुन्छ।
२. मात्रा (Volume)
मात्रा भनेको निश्चित अवधिमा कति धेरै शेयर किनबेच भएको हो भन्ने हो। मूल्य वृद्धि वा गिरावट मात्र हेरेर निर्णय लिन नसकिन्छ, त्यसका साथसाथै मात्राको विश्लेषण गर्नु पनि महत्त्वपूर्ण हुन्छ। उच्च मात्राले कुनै ट्रेन्डलाई बलियो बनाउँछ भने कम मात्राले बजारमा असमझदारीको संकेत दिन सक्छ। उदाहरणको लागि, यदि कुनै स्टकको मूल्य वृद्धि भएको छ तर मात्रामा कमी आएको छ भने त्यसले लगानीकर्तामा विश्वासको अभाव देखाउँछ।
३. समर्थन र प्रतिरोध स्तर (Support and Resistance Levels)
मूल्यको विश्लेषण गर्दा समर्थन (support) र प्रतिरोध (resistance) स्तरको अध्ययन गर्नु अत्यन्त महत्त्वपूर्ण छ।
समर्थन स्तर: स्टकको मूल्य घट्दै गर्दा त्यो स्तरमा पुगेपछि किन्ने माग बढ्छ र त्यसपछि मूल्य फेरि बढ्न थाल्छ। यसलाई समर्थन स्तर भनिन्छ।
प्रतिरोध स्तर: जब स्टकको मूल्य बढ्दै जान्छ र एक बिन्दुमा पुगेर विक्रीका लागि अधिक माग देखिन्छ, तब त्यसले मूल्यलाई माथि जानबाट रोक्छ। यो बिन्दुलाई प्रतिरोध स्तर भनिन्छ।
लगानीकर्ताहरूले समर्थन र प्रतिरोध स्तरको आधारमा स्टक किन्ने वा बेच्ने निर्णय गर्न सक्छन्। समर्थन स्तरमा स्टक किन्नु र प्रतिरोध स्तरमा बेचनु प्रायः उपयोगी रणनीति मानिन्छ।
४. प्रवृत्ति र औसत चलन (Trend and Moving Averages)
बजारको कुनै परिसम्पत्तिले लामो समयसम्म बढ्ने वा घट्ने प्रवृत्ति देखाउँछ भने, त्यसलाई बजारको ट्रेन्ड भनिन्छ।
औसत चलन (Moving Average): कुनै विशेष अवधिमा स्टकको औसत मूल्य गणना गरेर त्यसलाई चार्टमा देखाउने प्रविधि हो। यसले स्टकको विगतको प्रदर्शनको विस्तृत झलक दिन्छ। साधारणतया, लगानीकर्ताहरू ५०-दिन, १००-दिन, र २००-दिनको औसत चलन प्रयोग गर्छन्।
औसत चलनमा आधारित रणनीतिहरूले लगानीकर्तालाई कुनै पनि स्टकको दीर्घकालीन मूल्यको दिशाबारे सल्लाह दिन्छन्। जब कुनै स्टकको मूल्य लामो अवधिको औसत चलनभन्दा माथि हुन्छ भने यो "बुलिश" संकेत हो, र जब तल हुन्छ भने "बेरिश" संकेत हुन्छ।
५. चार्ट ढाँचाहरू (Chart Patterns)
टेक्निकल एनालिसिसको महत्त्वपूर्ण अंश भनेको विभिन्न चार्ट ढाँचाहरूको विश्लेषण गर्नु हो। यी ढाँचाहरूले बजारको आगामी दिशाबारे इशारा दिन्छन्।
हेड एन्ड शोल्डर (Head and Shoulders): यो ढाँचाले सामान्यतया बजारमा उल्टो ट्रेन्डको संकेत दिन्छ। जब स्टकले यस ढाँचाको रूप धारण गर्छ भने, स्टकको मूल्य बढ्न थाल्न सक्छ वा गिरावट हुन सक्छ।
डबल टप र डबल बटम (Double Top and Double Bottom): यी ढाँचाहरूले बजारको चालमा उल्टो आउने सम्भावना देखाउँछन्। डबल टपले गिरावटको संकेत दिन्छ भने डबल बटमले मूल्य वृद्धि हुने सम्भावना देखाउँछ।
६. आरएसआई (RSI – Relative Strength Index)
आरएसआई एक प्राविधिक सूचक हो जसले बजारको वर्तमान मूल्यबारे लगानीकर्ताहरूको भावनाको जानकारी दिन्छ। यो ० देखि १०० सम्मको सूचकांक हो, जहाँ ७० भन्दा माथि हुने सूचकलाई ‘अत्यधिक किनिएको’ र ३० भन्दा तल हुने सूचकलाई ‘अत्यधिक बेचेको’ मानिन्छ। ७० भन्दा माथिको सूचकले स्टकमा बिकवालीको सम्भावना देखाउँछ भने ३० भन्दा तलको सूचकले खरिदको अवसर देखाउँछ।
टेक्निकल एनालिसिसको महत्त्व
टेक्निकल एनालिसिसले लगानीकर्ताहरूलाई बजारमा प्रवेश गर्ने र बाहिर निस्कने सही समयबारे जानकारी दिन्छ। बजारको विगतको चाल, मात्रा, समर्थन-प्रतिरोध, औसत चलन, र आरएसआई जस्ता सूचकहरूको प्रयोग गरेर लगानीकर्ताले बजारको भविष्यको चालको सम्भावित दिशाबारे अनुमान लगाउन सक्छन्। टेक्निकल एनालिसिसका फाइदाहरू यस प्रकार छन्:
समयको बचत: टेक्निकल एनालिसिसले लगानीकर्तालाई बजारमा लगानी गर्नको लागि उपयुक्त समयको चयनमा मद्दत पुर्याउँछ। यसले गर्दा अनावश्यक व्यापारबाट बच्न सकिन्छ।
सटीक निर्णय: बजारमा हुने अनिश्चितताबीच, यो विधिले निर्णयमा स्पष्टता ल्याउँछ।
रुझानको पहिचान: बजारको प्रमुख ट्रेन्डहरू पहिचान गरेर, लगानीकर्ताले सही समयमा व्यापार गर्न सक्छन्।
जोखिम व्यवस्थापन: टेक्निकल एनालिसिसले बजारमा भएका संभावित गिरावटहरूबाट बच्न सहयोग गर्छ।
टेक्निकल एनालिसिस लगानीकर्ताहरूका लागि बजारको चाल बुझ्न र सही निर्णय लिन अत्यन्त महत्त्वपूर्ण साधन हो। यसले बजारका ऐतिहासिक चलखेलहरू र सूचकांकहरूको अध्ययन गरेर भविष्यमा बजारको सम्भावित दिशाको अनुमान दिन्छ। तर, यस विधिलाई पूर्ण रूपमा आत्मविश्वासपूर्वक प्रयोग गर्नु अघि अभ्यास र गहिरो अध्ययन आवश्यक छ। टेक्निकल एनालिसिसका आधारमा लगानी गर्दा संयम, धैर्य, र अनुसन्धानको आवश्यकता हुन्छ, जसले दीर्घकालीन सफलताको सम्भावना बलियो बनाउँछ।